Manually Symbolicate Stack Trace for iOS App
今天我又来大战 Xcode 了, 哎。
ObjC 太垃圾, 垃圾到我用 Rust 写完功能然后链接到 iOS App 里, 但这也带来一个问题: Xcode 不
认识 Rust 也就没办法调试 Rust, 那如果 Rust 代码崩溃了怎么办?
接下来就来讲讲如何手动定位崩溃位置。
注: 本文将使用 stack 和 heap 而不是其中文译名因为它的中文译名极易混淆。
写个 demo
iOS App 工程
用 Xcode 新建一个 iOS App 工程, 文件 main.m 内容如下:
@import UIKit;

#import "AppDelegate.h"

// Prototype of the function where it crashes once called.
void libmansymb_crash(void);

int main(int argc, char * argv[]) {
    NSString * appDelegateClassName;
    @autoreleasepool {
        // Setup code that might create autoreleased objects goes here.
        appDelegateClassName = NSStringFromClass([AppDelegate class]);
    }

    libmansymb_crash(); // Crash the app.

    return UIApplicationMain(argc, argv, nil, appDelegateClassName);
}
再在要编译的目标的 Build Settings 里修改 ENABLE_BITCODE 值为 false, 否则这个目标将
无法与静态库链接。
Rust 静态库工程
再用命令创建一个 Rust 工程:
cargo new --lib libmansymb
在 Rust 工程内的 Cargo.toml 文件里定义一个 lib:
[lib]
name = "mansymb"
crate-type = ["staticlib"]
再修改 Rust 工程的 src/lib.rs 文件, 内容如下:
#[no_mangle]
pub extern "system" fn libmansymb_crash() -> () {
  crash_now();
}

fn crash_now() -> () {
  let to_unwrap: Option<i32> = Option::None;
  let unwrapped = to_unwrap.unwrap();
  println!("unwrapped -> {}", unwrapped);
}
然后用 cargo 编译 Rust 工程为可以给 iOS 用的静态库:
cargo build --target aarch64-apple-ios --lib
编译后的静态库文件在 工程目录/target/aarch64-apple-ios/debug/libmansymb.a, 然后再把
这个静态库链接到之前创建的 iOS App 工程, 然后运行, 然后这个 app 就应该立刻崩溃了, 并且
Xcode 会展示具体的崩溃的位置:
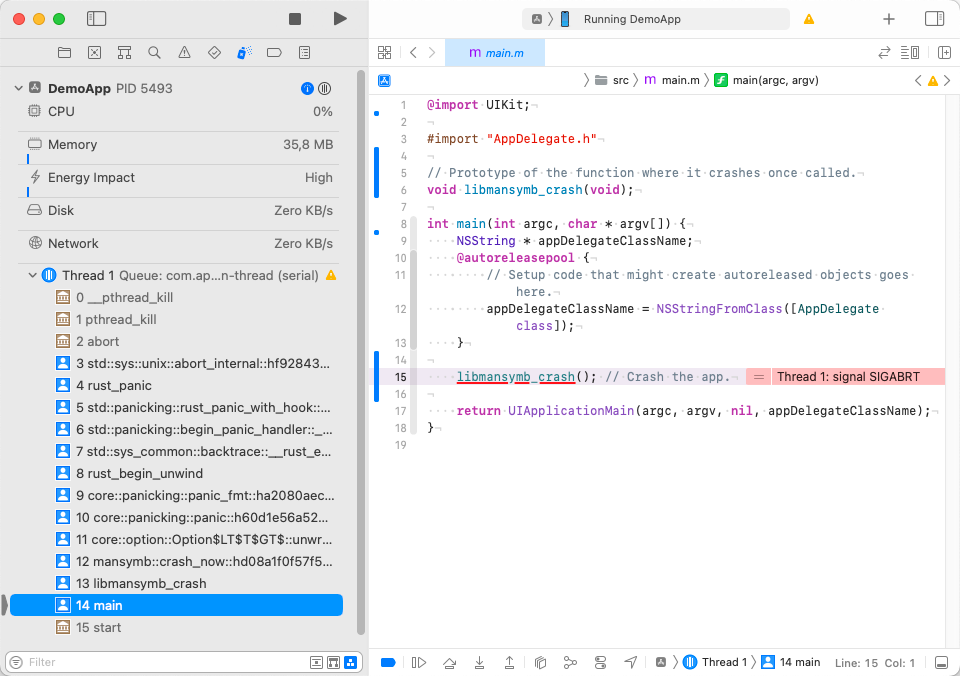
当然, 这是 Xcode 发挥良好的情况下能让你看到发生崩溃的位置, 当 Xcode 抽风的时候就需要自己动手 了。
Worst-Case Scenario
假如这个软件上架了 App Store, 不久后很多用户给这个软件写差评说是软件打开就崩溃。现在我们假定 以下最糟糕的情况:
- 用 Rust 编写的库在编译时使用了
--release参数; - 文件
Cargo.toml内打开了各种优化:[profile.release] strip = true opt-level = "z" lto = true codegen-units = 1 panic = "abort" - 无法使用 Xcode;
- 你能找到的错误信息只有第三方平台(比如 Firebase Crashlytics)提供的错误信息;
Crashlytics 会要求开发者上传 symbol table 并自动 symbolicate stack trace, 于是 Crashlytics 给出的 symbolicated stack trace 应该是这样的:
Crashed: com.apple.main-thread
0   libsystem_kernel.dylib        	0x?????? __pthread_kill + 8
1   libsystem_pthread.dylib       	0x?????? pthread_kill + 272
2   libsystem_c.dylib             	0x?????? abort + 104
3   DemoApp                       	0xca58   __rust_alloc + 0
4   DemoApp                       	0xca4c   panic_abort::__rust_start_panic::abort::hf63d08400a9da3bd + 51788 (lib.rs:42)
5   DemoApp                       	0x298a4  std::panic::get_backtrace_style::haac55d35f9a930ed + 170148 (panic.rs:287)
6   DemoApp                       	0x2dc28  std::panicking::rust_panic_with_hook::h450c8571944e8e06 + 187432 (panicking.rs:698)
7   DemoApp                       	0x2d858  std::panicking::begin_panic_handler::_$u7b$$u7b$closure$u7d$$u7d$::hd8204fd933fb4070 + 186456 (panicking.rs:589)
8   DemoApp                       	0x2d7f0  std::panicking::begin_panic_handler::_$u7b$$u7b$closure$u7d$$u7d$::hd8204fd933fb4070 + 186352 (panicking.rs:584)
9   DemoApp                       	0x2d7bc  core::option::Option$LT$T$GT$::unwrap::h4b52fdbeb7909c35 + 186300 (option.rs:750)
10  DemoApp                       	0xd4f3bc core::slice::index::slice_start_index_len_fail::h90de969d8504534e + 13956028 (index.rs:34)
11  DemoApp                       	0xd4f494 core::slice::index::slice_index_order_fail::hd4ba12df6229b864 + 13956244 (index.rs:50)
12  DemoApp                       	0x7c80   addr2line::path_push::h8dcd4c3de6b339f4 + 0
13  DemoApp                       	0x7c2c   main + 31788 (main.m:17)
14  libdyld.dylib                 	0x?????? start + 4
从 Crashlytics 给出的 stack trace 来看, 看上去编译器已经把我们自己写的 Rust 代码优化没了。
如果是从 “Xcode -> Window -> Devices and Simulators -> Your iOS Device -> View Device Logs” 取得的 stack trace 应该是这样的:
...

Exception Type:  EXC_CRASH (SIGABRT)
Exception Codes: 0x0000000000000000, 0x0000000000000000
Exception Note:  EXC_CORPSE_NOTIFY
Triggered by Thread:  0

Application Specific Information:
abort() called

Thread 0 name:  Dispatch queue: com.apple.main-thread
Thread 0 Crashed:
0   libsystem_kernel.dylib        	0x00000001bd49b414 0x1bd473000 + 164884
1   libsystem_pthread.dylib       	0x00000001d99b3b40 0x1d99b1000 + 11072
2   libsystem_c.dylib             	0x00000001998c0b74 0x19984a000 + 486260
3   DemoApp                       	0x0000000100368a58 0x10035c000 + 51800
4   DemoApp                       	0x0000000100368a4c 0x10035c000 + 51788
5   DemoApp                       	0x00000001003858a4 0x10035c000 + 170148
6   DemoApp                       	0x0000000100389c28 0x10035c000 + 187432
7   DemoApp                       	0x0000000100389858 0x10035c000 + 186456
8   DemoApp                       	0x00000001003897f0 0x10035c000 + 186352
9   DemoApp                       	0x00000001003897bc 0x10035c000 + 186300
10  DemoApp                       	0x00000001010ab3bc 0x10035c000 + 13956028
11  DemoApp                       	0x00000001010ab494 0x10035c000 + 13956244
12  DemoApp                       	0x0000000100363c80 0x10035c000 + 31872
13  DemoApp                       	0x0000000100363c2c 0x10035c000 + 31788
14  libdyld.dylib                 	0x00000001901d16c0 0x1901d0000 + 5824

Thread 0 crashed with ARM Thread State (64-bit):
    x0: 0x0000000000000000   x1: 0x0000000000000000   x2: 0x0000000000000000   x3: 0x0000000000000000
    x4: 0x0000010100000180   x5: 0x0000000000000000   x6: 0x00000101000001c0   x7: 0x0000000000000100
    x8: 0x00000000000005b9   x9: 0xffcc0a2413708e9d  x10: 0x0000000000000101  x11: 0x0000000000000000
   x12: 0x0000000000000000  x13: 0x00000000000001c0  x14: 0x0000000000000005  x15: 0x00000000000000ca
   x16: 0x0000000000000148  x17: 0x00000001032f38c0  x18: 0x0000000000000000  x19: 0x0000000000000006
   x20: 0x0000000000000407  x21: 0x00000001032f39a0  x22: 0x0000000101225c38  x23: 0x00000001012b7588
   x24: 0x0000000000000001  x25: 0x0000000000000000  x26: 0x0000000000000000  x27: 0x0000000000000000
   x28: 0x000000016faa3ae0   fp: 0x000000016faa3830   lr: 0x00000001d99b3b40
    sp: 0x000000016faa3810   pc: 0x00000001bd49b414 cpsr: 0x40000000
   esr: 0x56000080  Address size fault

Binary Images:
0x10035c000 - 0x101223fff DemoApp arm64  <8b4866a72fc43581b2476ba19303c8b6> /var/containers/Bundle/Application/C35088BC-4B98-4305-8BB6-AFCFC4A42F8A/DemoApp.app/DemoApp

...
虽然 macOS 自带了 atos 这个类似于 addr2line 的工具可以自动 symbolicate stack
trace, 但它们是怎么工作的? 以及如何手动 symbolicate stack trace 而不使用这些工具?
Manually Symbolicate Stack Trace
ASLR(Address Space Layout Randomization)
我十几岁的那时候流行用易语言做游戏作弊工具, 当时大陆某视频网站里还有很多比我年龄还小的人讲解如何
写外挂, 其中有个令我印象很深刻的词: 基地加偏移。
在很久以前的计算机上运行的程序都是需要在特定内存地址运行的, 当时计算机里只有一个程序在运行,
在代码内使用绝对地址位置访问内存也没什么问题。
后来计算机飞速发展导致现在许多程序运行在同一个计算机里, 再加上操作系统的存在, 使得程序必须能在
任意内存地址运行, 于是
PIE(Position-Independent Executable)
就诞生了。这就意味着: 每次程序运行的时候, 程序本体都有可能被存放在不同的内存地址里, 也就导致了
上面提到的 “基址” 会有些变化。
上面从 Xcode 给出的崩溃信息里有这样一段内容:
Binary Images:
0x10035c000 - 0x101223fff DemoApp arm64
其中 0x10035c000 就是 DemoApp 的机器码的起始地址(被 MMU 映射后的虚拟地址), 每次软件运行
时都可能是不一样的值, 所以它不是上面所提到的 “基址”。
如果想 symbolicate stack trace 就需要找到 DemoApp 软件的 “基址”, 通过如下命令就能找到它
了:
otool -l ./DemoApp
会得到如下输出:
...
Load command 1
      cmd LC_SEGMENT_64       # Load Command: Segment
  cmdsize 952
  segname __TEXT              # Segment Name
   vmaddr 0x0000000100000000  # Segment starts at
   vmsize 0x0000000000ec8000  # and its size.
  fileoff 0
 filesize 15499264
  maxprot 0x00000005
 initprot 0x00000005
   nsects 11
    flags 0x0
...
在 ELF 文件中 segment name 为 __TEXT 的部分就是机器码的起始位置, 它所在的地址是
0x100000000。上面提到的 DemoApp 在内存里的起始地址是 0x10035c000, 这个值与
__TEXT 的起始位置也就是 0x100000000 的差就是 ASLR Slide 了, 也就是 iOS 把软件载入
到了内存地址 0x100000000 + 0x35c000 的位置, 者差不多就是 “基址加偏移” 的含义了。
(实际上 “基址+偏移” 的偏移是指每次指针从当前地址去往另一个内存地址的差, 只是上面将错就错的用了
这个概念。)
跟踪函数调用
现在再来看在 strack trace 最底部的函数调用:
13  DemoApp                       	0x0000000100363c2c 0x10035c000 + 31788
14  libdyld.dylib                 	0x00000001901d16c0 0x1901d0000 + 5824
看上去是从 libdyld.dylib 跳到了 DemoApp 的地址 0x100363c2c, 把它减去前面算得的 ASLR
Slide 0x35c000 得到地址 0x100007c2c, 这个地址就是 DemoApp 的某个函数的某个位置的地址
了。
接下来去看这个函数的汇编, 用 lldb 载入 DemoApp 可执行文件:
lldb ./DemoApp
然后反汇编上面的地址 0x100007c2c:
(lldb) disassemble -a 0x100007c2c
得到如下输出:
DemoApp`main:
DemoApp[0x100007bdc] <+0>:   stp    x22, x21, [sp, #-0x30]!
DemoApp[0x100007be0] <+4>:   stp    x20, x19, [sp, #0x10]
DemoApp[0x100007be4] <+8>:   stp    x29, x30, [sp, #0x20]
DemoApp[0x100007be8] <+12>:  add    x29, sp, #0x20
DemoApp[0x100007bec] <+16>:  mov    x19, x1
DemoApp[0x100007bf0] <+20>:  mov    x20, x0
DemoApp[0x100007bf4] <+24>:  bl     0x100d64a94               ; symbol stub for: objc_autoreleasePoolPush
DemoApp[0x100007bf8] <+28>:  mov    x21, x0
DemoApp[0x100007bfc] <+32>:  adrp   x8, 3923
DemoApp[0x100007c00] <+36>:  ldr    x0, [x8, #0xd80]
DemoApp[0x100007c04] <+40>:  nop
DemoApp[0x100007c08] <+44>:  ldr    x1, [x8, #0x8f0]
DemoApp[0x100007c0c] <+48>:  bl     0x100d64af4               ; symbol stub for: objc_msgSend
DemoApp[0x100007c10] <+52>:  bl     0x100d64548               ; symbol stub for: NSStringFromClass
DemoApp[0x100007c14] <+56>:  mov    x29, x29
DemoApp[0x100007c18] <+60>:  bl     0x100d64b30               ; symbol stub for: objc_retainAutoreleasedReturnValue
DemoApp[0x100007c1c] <+64>:  mov    x22, x0
DemoApp[0x100007c20] <+68>:  mov    x0, x21
DemoApp[0x100007c24] <+72>:  bl     0x100d64a88               ; symbol stub for: objc_autoreleasePoolPop
DemoApp[0x100007c28] <+76>:  bl     0x100007c60               ; libmansymb_crash
DemoApp[0x100007c2c] <+80>:  mov    x0, x20
DemoApp[0x100007c30] <+84>:  mov    x1, x19
DemoApp[0x100007c34] <+88>:  mov    x2, #0x0
DemoApp[0x100007c38] <+92>:  mov    x3, x22
DemoApp[0x100007c3c] <+96>:  bl     0x100d64680               ; symbol stub for: UIApplicationMain
DemoApp[0x100007c40] <+100>: mov    x19, x0
DemoApp[0x100007c44] <+104>: mov    x0, x22
DemoApp[0x100007c48] <+108>: bl     0x100d64b0c               ; symbol stub for: objc_release
DemoApp[0x100007c4c] <+112>: mov    x0, x19
DemoApp[0x100007c50] <+116>: ldp    x29, x30, [sp, #0x20]
DemoApp[0x100007c54] <+120>: ldp    x20, x19, [sp, #0x10]
DemoApp[0x100007c58] <+124>: ldp    x22, x21, [sp], #0x30
DemoApp[0x100007c5c] <+128>: ret
快看, 是 main 函数! 而位于 0x100007c2c 的汇编代码是:
DemoApp[0x100007c28] <+76>:  bl     0x100007c60               ; libmansymb_crash
DemoApp[0x100007c2c] <+80>:  mov    x0, x20                   ; 这一行
但 0x100007c2c 并没有跳转到 libmansymb_crash 函数, 而上一条汇编指令才是跳转到
libmansymb_crash 函数。
在 Apple 的文档 Examining the Fields in a Crash Report 一文有如下解释:
The address of the machine instruction that is executing. For frame 0 in each backtrace, this is the address of the machine instruction executing on a thread when the process terminated. For other stack frames, this is the address of first machine instruction that executes after control returns to that stack frame.
所以必须回到 0x100007c2c 的上一条指令的地址也就是 0x100007c28 才是调用函数
libmansymb_crash 的地方。
位于 0x100007c28 的汇编指令是:
bl 0x100007c60
也就是跳到地址 0x100007c60, 那就用 lldb 反汇编一下这个地址的函数:
(lldb) disassemble -a 0x100007c60
得到如下输出:
DemoApp`libmansymb_crash:
DemoApp[0x100007c60] <+0>:  stp    x29, x30, [sp, #-0x10]!
DemoApp[0x100007c64] <+4>:  mov    x29, sp
DemoApp[0x100007c68] <+8>:  adrp   x0, 3427
DemoApp[0x100007c6c] <+12>: add    x0, x0, #0xb7b
DemoApp[0x100007c70] <+16>: adrp   x2, 3777
DemoApp[0x100007c74] <+20>: add    x2, x2, #0x860
DemoApp[0x100007c78] <+24>: mov    w1, #0x2b
DemoApp[0x100007c7c] <+28>: bl     0x100d4f45c               ; core::panicking::panic::h60d1e56a524bcbed at panicking.rs:41
函数末尾直接跳到 rust 的 panic 函数了, 除此之外再无任何跳转命令, 也就证实了上面提到的观点:
看上去编译器已经把我们自己写的 Rust 代码优化没了。
说明编译器 100% 确定这段代码一定会 panic。
Symbolicate with dwarfdump
DWARF 是一个标准化的调试数据文件格式, 文件里包含了尽可能详细的调试信息, 工具
addr2line 和 macOS 的 atos 就是通过这个文件将指令地址映射到对应的代码文件的位置的。
使用 dwarfdump 工具可以把文件内容翻译至人类可读的文本格式, 找到随同 DemoApp 的 DWARF
文件, 一般情况下位于 ./DemoApp.app.dSYM/Contents/Resources/DWARF/DemoApp, 然后使用
dwarfdump 将其内容转换为文本格式并保存到一个文件里:
dwarfdump --all ./DemoApp.app.dSYM/Contents/Resources/DWARF/DemoApp > ./DemoApp.dwarfdump.txt
上一小节里有提到 3 个地址, 它们分别是:
| 地址 | 含义 |
|---|---|
| 0x100007c28 | main 函数内调用 libmansymb_crash 函数地址 |
| 0x100007c60 | 函数 libmansymb_crash 的起始地址 |
| 0x100d4f45c | Rust panic 函数的起始地址 |
现在再在 DemoApp.dwarfdump.txt 文件内搜索 100007c28, 记得去掉前面的 0x 因为 0x
后面可能会补一些 0 并且搜索时要不区分大小写, 大概会找到这样的内容:
debug_line[0x0000c4ac]
Line table prologue:
    total_length: 0x000001bf
          format: DWARF32
         version: 4
 prologue_length: 0x0000018a
 min_inst_length: 1
max_ops_per_inst: 1
 default_is_stmt: 1
       line_base: -5
      line_range: 14
     opcode_base: 13
standard_opcode_lengths[DW_LNS_copy] = 0
standard_opcode_lengths[DW_LNS_advance_pc] = 1
standard_opcode_lengths[DW_LNS_advance_line] = 1
standard_opcode_lengths[DW_LNS_set_file] = 1
standard_opcode_lengths[DW_LNS_set_column] = 1
standard_opcode_lengths[DW_LNS_negate_stmt] = 0
standard_opcode_lengths[DW_LNS_set_basic_block] = 0
standard_opcode_lengths[DW_LNS_const_add_pc] = 0
standard_opcode_lengths[DW_LNS_fixed_advance_pc] = 1
standard_opcode_lengths[DW_LNS_set_prologue_end] = 0
standard_opcode_lengths[DW_LNS_set_epilogue_begin] = 0
standard_opcode_lengths[DW_LNS_set_isa] = 1
include_directories[  1] = "DemoVpnApp/src"
include_directories[  2] = "/Applications/Xcode.app/Contents/Developer/Platforms/iPhoneOS.platform/Developer/SDKs/iPhoneOS15.5.sdk/System/Library/Frameworks/Foundation.framework/Headers"
include_directories[  3] = "/Applications/Xcode.app/Contents/Developer/Platforms/iPhoneOS.platform/Developer/SDKs/iPhoneOS15.5.sdk/System/Library/Frameworks/UIKit.framework/Headers"
file_names[  1]:
           name: "main.m"
      dir_index: 1
       mod_time: 0x00000000
         length: 0x00000000
file_names[  2]:
           name: "NSObjCRuntime.h"
      dir_index: 2
       mod_time: 0x00000000
         length: 0x00000000
file_names[  3]:
           name: "UIApplication.h"
      dir_index: 3
       mod_time: 0x00000000
         length: 0x00000000

Address            Line   Column File   ISA Discriminator Flags
------------------ ------ ------ ------ --- ------------- -------------
0x0000000100007bdc      8      0      1   0             0  is_stmt
0x0000000100007bf4     10     22      1   0             0  is_stmt prologue_end
0x0000000100007bfc     12     50      1   0             0  is_stmt
0x0000000100007c10     12     32      1   0             0
0x0000000100007c18      0     32      1   0             0
0x0000000100007c20     13      5      1   0             0  is_stmt
0x0000000100007c28     15      5      1   0             0  is_stmt
0x0000000100007c2c     17     12      1   0             0  is_stmt
0x0000000100007c44     18      1      1   0             0  is_stmt
0x0000000100007c60     18      1      1   0             0  is_stmt end_sequence
这段内容花个几分钟就能看明白了。
那么之前提到的位于 0x100007c28 地址的指令参照上面的表格来看位于文件 main.m#15:5, 打开
main.m 文件定位到第 15 行第 5 列后找到源码的是:
libmansymb_crash(); // Crash the app.
这正是之前调用 rust 崩溃代码的代码。
按照这个思路, 几乎所有的 stack trace 都能找到对应的源代码的位置了。但要注意一点: 编译器优化 开得越高, symbol table 的定位就越不精确。
其实 lldb 可以在反汇编的时候引用 DWARF 文件内容, 使用下面的命令:
(lldb) target symbols add <DwarfFile>
lldb 就能在反汇编的时候带上一些信息, 比如下面代码片段里分号(;)右侧的信息就是来源于 DWARF 文件:
DemoApp[0x100007c7c] <+28>: bl 0x100d4f45c ; core::panicking::panic::h60d1e56a524bcbed at panicking.rs:41
Conclusion
如果有对线上软件查找错误信息的需求的话, 可以按照下面的方法编译:
- 适当的调低或关掉编译器优化;
- 链接静态库时保存好对应的 symbol table;
- 按照本文的方法跟踪崩溃。
References: